Your Likes
How, When and Where
We talked briefly about the different sections in Facebook Insights in our last blog. Now, we are going to look deeper into each of the sections. First up, is the Likes section…
A growing audience on Facebook is a sign of a healthy community. But you need to do more than measure the number of new fans to understand how your audience is growing and identify effective tactics for sustaining growth. You need to determine how users are finding your Page. To do that you’ll need to analyse your Like Sources.
The ‘Likes’ tab will show you:
- Your total likes as of that day.
- Your ‘Net Likes’ – this features organic likes, paid likes and unlikes.
- Where your page likes happened – i.e. using the like button on your page or from page suggestions, ads, and stories about others who have liked your page.
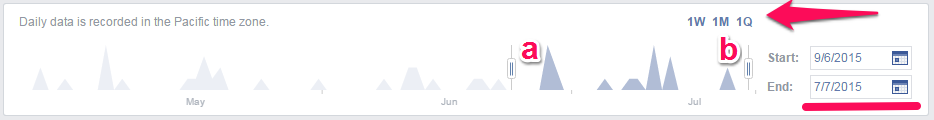
The first graph you’ll encounter is general overview of your likes/unlikes. Using the tools available, you can choose what time period you view.
The sliders, marked ‘a’ and ‘b’ below, can be moved left and right to pick the dates you want to view.
You can also view data from 1 week, 1 Month or 1 Quarter by clicking on 1W, 1M or 1Q respectively. Using the Start and End date boxes you can also choose a specific time frame. The smallest time period you can choose is a week. The dates you pick here will be shown in the graphs below.
Next up, is the Total Page Likes graph. It pretty much does what it says on the tin. By hovering over the shaded blue area with your cursor, you can select a date to drill down further into. Simply click on the date required to view the data.
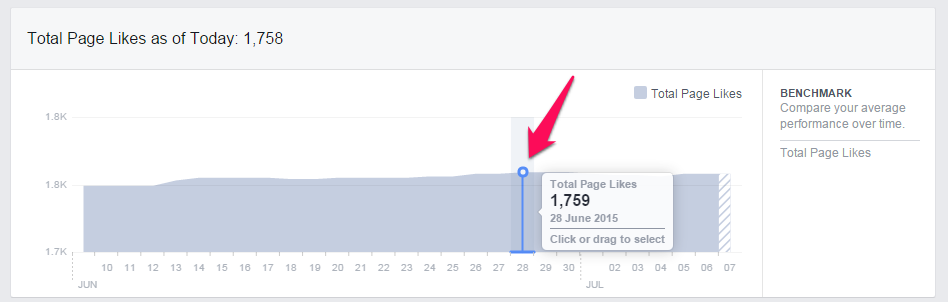
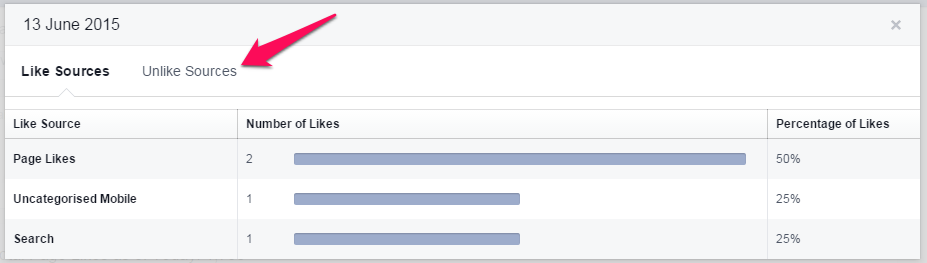
An info box will pop up with further information about your required date. You will see your Like and Unlike Sources. For instance, below you can see that on 13 June, the page received 4 Likes and these Likes are broken down further by Source.
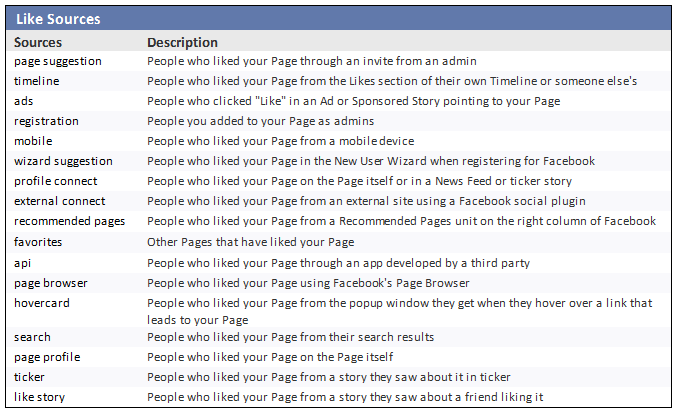
This is a fairly comprehensive list of the different Like sources. Unless your page has received a Like from one of these sources, you will not see them in your Insights.
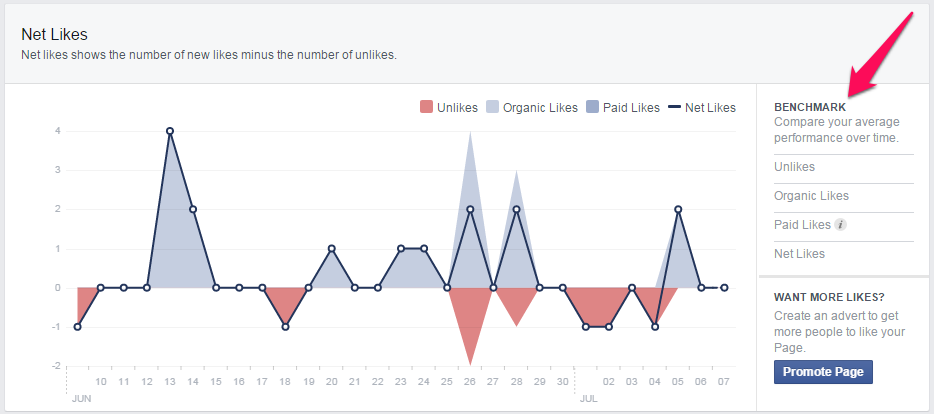
Next, we have to your Net Likes. Here you can see your Net Likes for the selected time period. Net Likes are your Likes minus your Unlike. You can see Likes shaded blue and Unlikes shaded in red with the Net Likes line in dark blue. Again, by clicking on a date, you can see further info on that date.
You can view each metric individually by clicking on the list under Benchmark.
Following on from this we have a graph which explains where your Page Likes happened. You can use this to see where your page is growing from and what is (or isn’t) working for you.
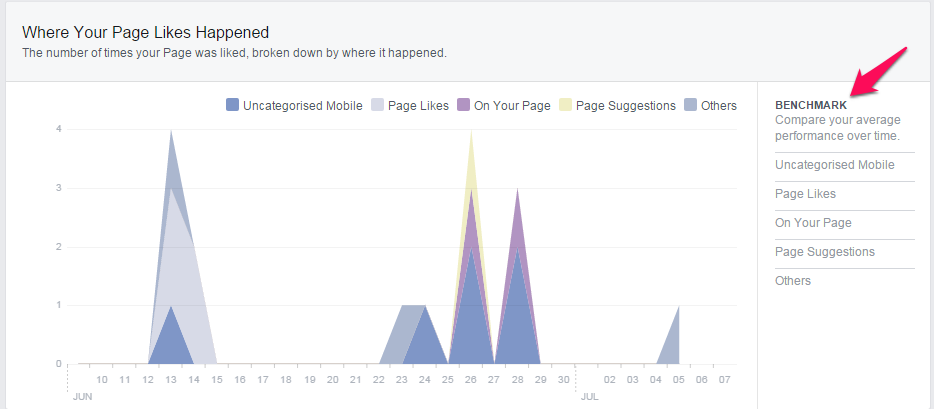
You can use the Likes Tab to effectively track how your page is performing. It’s quick and easy to decipher. For instance, if you view your Net Likes and notice a spike in your Unlikes on a particular date, you can investigate what activity may have lead to multiple Unlikes. And conversely, an increase in Likes will show you what has worked for your page and more importantly, where those Likes are coming from.
Our next blog in this series will talk about the Reach Tab in your Insights.
Stay Tuned!